Renal units pioneer electronic records
In the UK through the 1970s and 1980s renal units found themselves responsible for increasing numbers of patients, and services were stretched to capacity and beyond in seeking to cope with pressure of new starts. Managing their complex treatments and monitoring frequent test results was a major problem for understaffed services. At Fulham hospital in West London in the late 1970s, doctors collaborated with computer programmers to simplify and speed storage and access to numerical data, presenting it both in tables and graphs. However as needs changed, they realised that a system that could be configured without involvement of skilled programmers would be more versatile. The principles spelled out in their 1983 paper should be read by today’s IT system designers.

Proton spread to serve most of the renal units in the UK, with a local server for each. Remarkably, in 2005 it still served 40% of UK renal units, and it still serves many thousands of renal patients today. The key to its longevity was its local configurability, so it could be adapted to local needs and new functions. The quality and accessibility of this data was also invaluable politically, it was used to draw attention to provision rates of dialysis and transplantation in different regions of the country. Renal registries went on to compare performance of different units in death rate, transplantation, anaemia, and an increasing number of other markers of quality of service, well in advance of such systematic evaluation of performance being implemented in most other specialties.
This relatively advanced level of electronic information provision became the norm in renal units in the UK, with several other IT companies offering renal systems over the next 20 years.
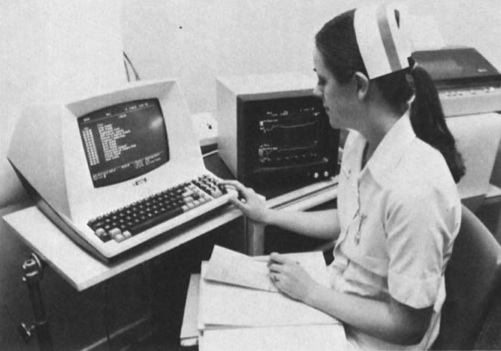
Images: Fig 1 is from Gordon et al 1983. Fig 2: Creative Commons.
3 responses to “The renal data revolution from 1980”
Could I get permission to use this NurseProton.jpg image in a Nursing Informatics course? Can you tell me any more about the source?
That's from the Kidney International Gordon et al reference 1983 – and we should have stated that, so have updated that. Internal use in a course – your University may well have an agreement covering it.
If not, try something complicated through Copyright.com as there aren't direct links to permissions from the journal online.